Range Trading-The Basics of Range Trading Strategy
Range trading is a strategy that profits from price moving repeatedly between support and resistance levels. By anticipating reversals at these boundaries, traders can find consistent opportunities when the market is not trending.
Introduction to Range Trading and the 4 Range Types
Range trading is a simple and common forex approach. It works well with trend-following or breakout strategies, but many traders also use it effectively by itself.
It’s usually easy to notice a range on a price chart. In many charts, the price clearly moves back and forth within a familiar zone. These areas are called ranges, and they appear in many different forms. Traders like to use ranges because they help reduce uncertainty. In this article we will explain the main types of ranges in forex and how to trade them.
The Fundamentals of Range Trading
Ranges form when price stays between support below and resistance above.
The simplest way to trade them is to act near those edges, sell when price reaches the top and buy when it drops to the bottom. The upper boundary acts as resistance, stopping upward moves, and the lower boundary acts as support, slowing downward moves.
Figure 1 shows a simple box-shaped range where price moves back and forth between two parallel lines.
Like any trading method, results depend on being careful and using the strategy correctly.
Types of Range
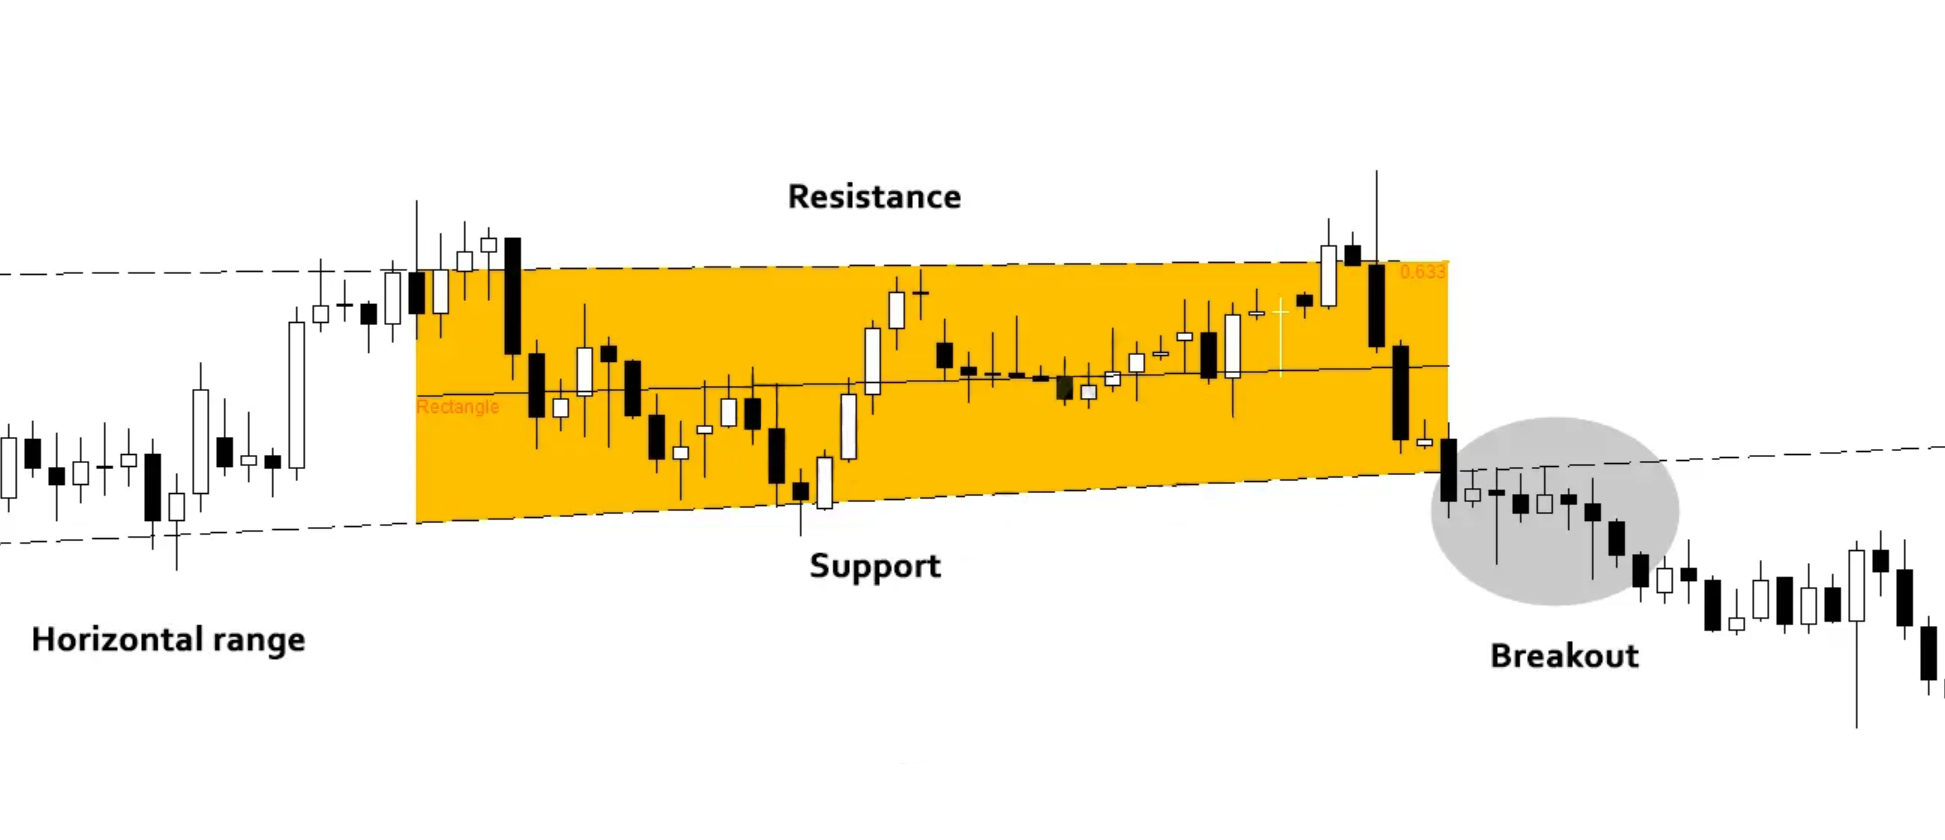
Rectangular range
In a rectangular range, price moves sideways between a top resistance area and a bottom support area that are both mostly horizontal and flat. These ranges appear on many timeframes, although they are less common than channels or continuation ranges. You can spot them easily on a chart by eye or by using indicators. A horizontal range usually shows:
- A clear top (resistance) and bottom (support)
- Moving averages that flatten out
- Highs and lows forming inside a horizontal band
Figure 2 shows an example of this type of range.
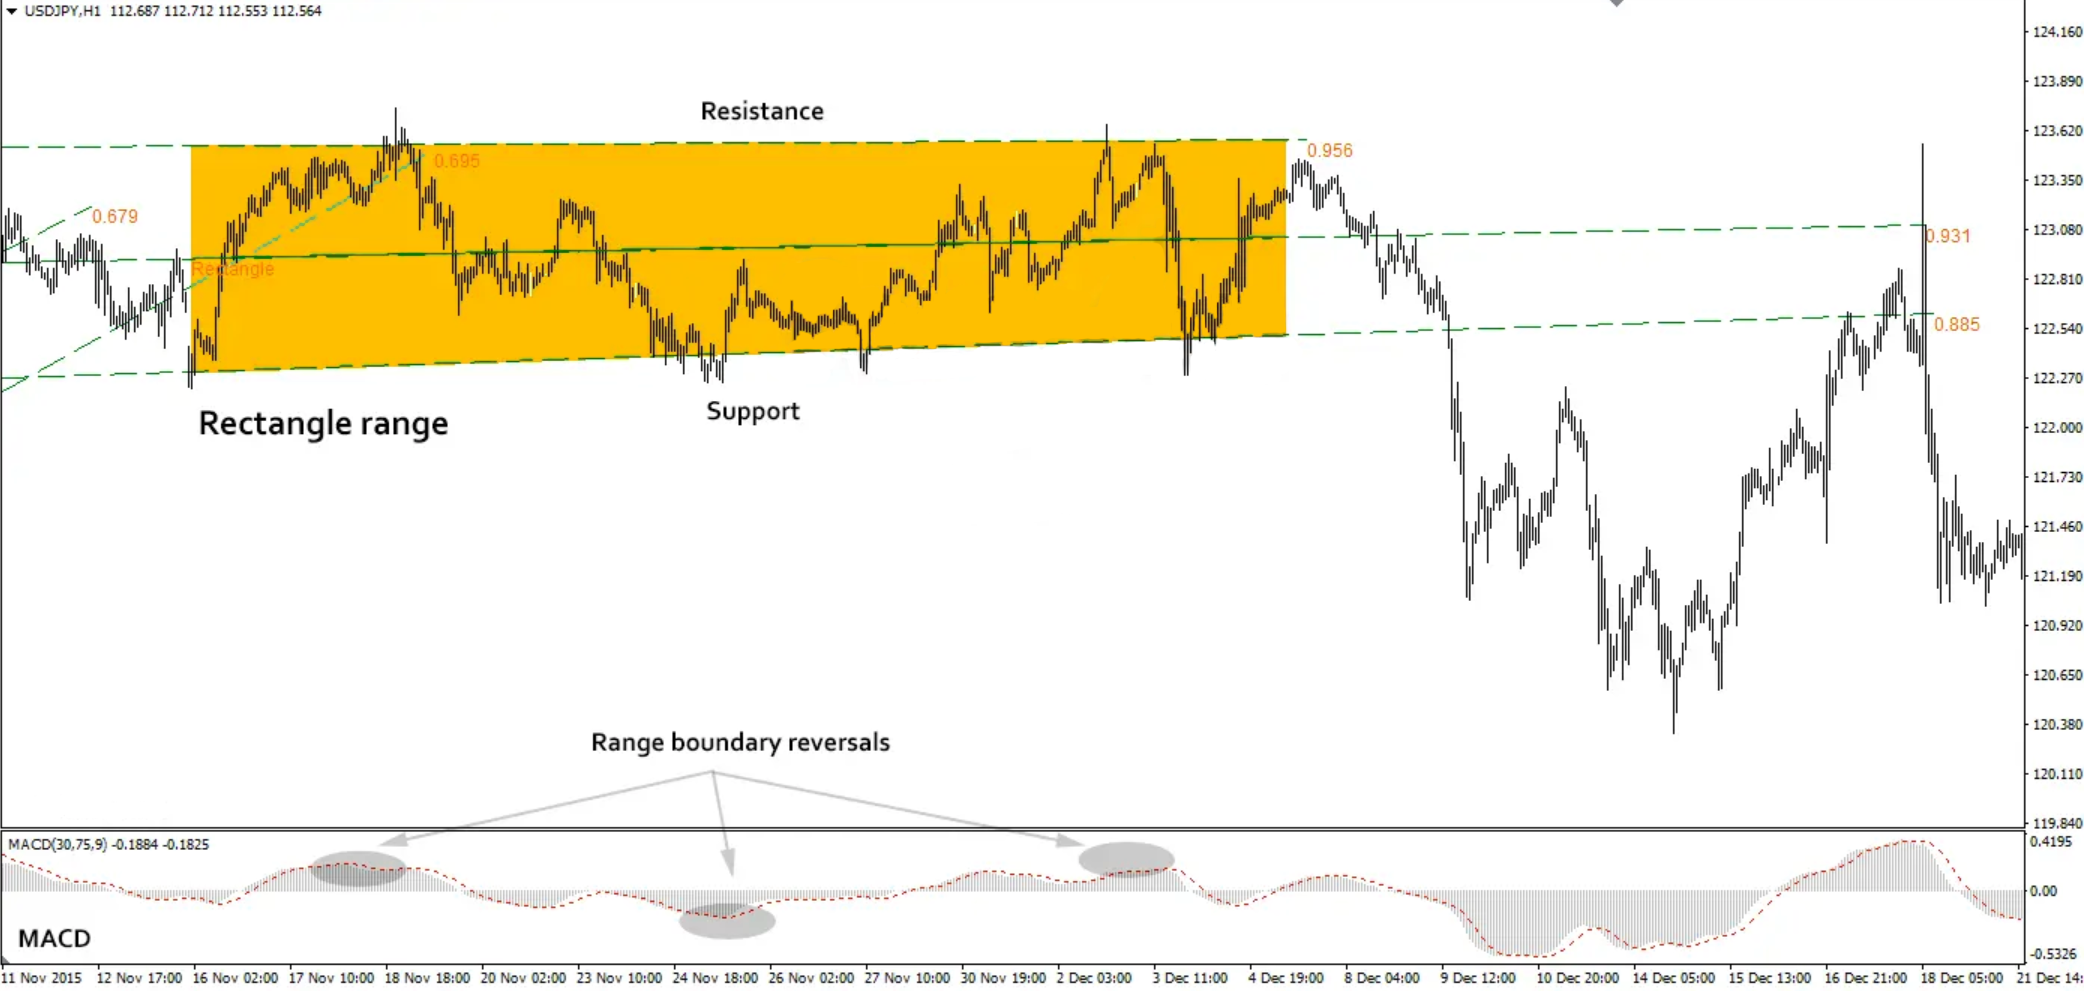
In this chart, the bottom indicator is MACD. When the MACD histogram (black) drops below the signal line (orange), it signals a possible sell. When it crosses upward, it suggests a buy. The height of the MACD bar also shows how overbought or oversold the market may be.
Indicators like MACD are useful when automating trades. ATR, RSI, and moving averages also help, and there are additional tools made specifically for automated trading.
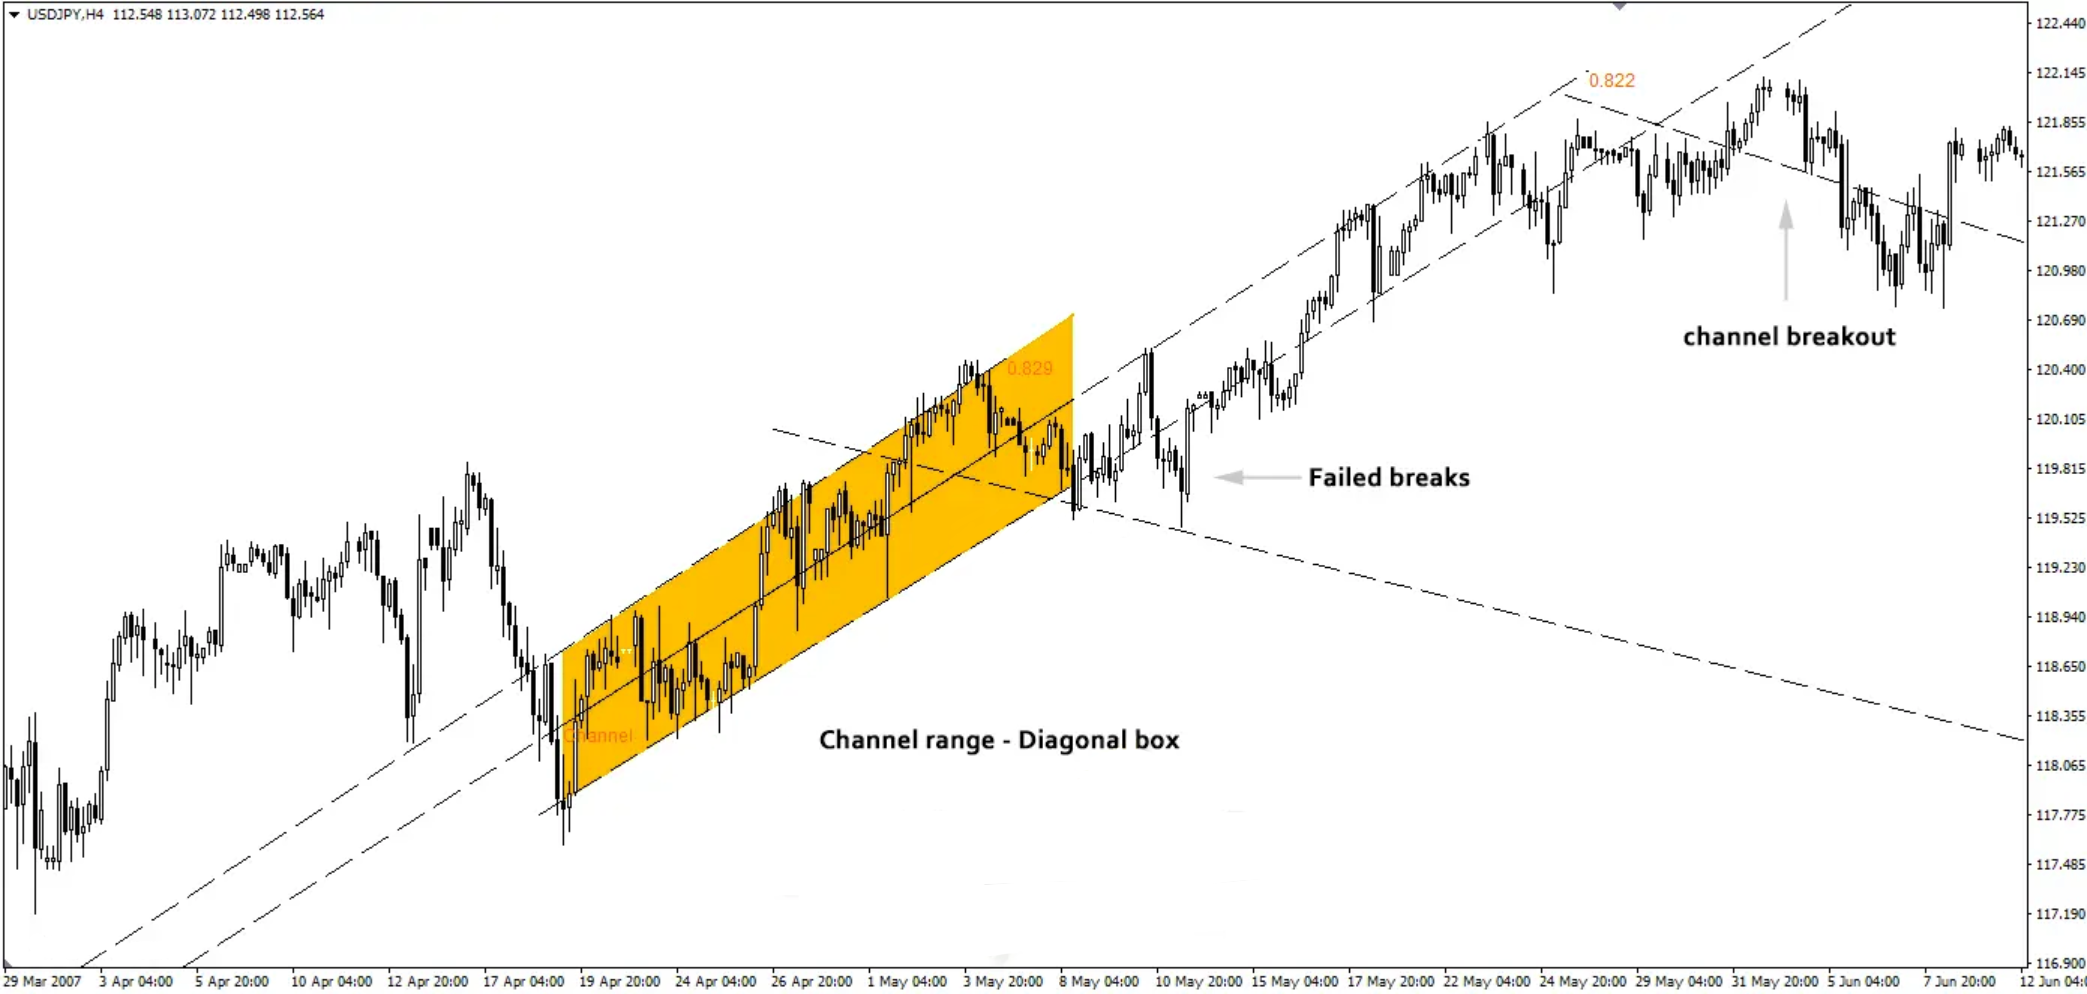
Price Channels (diagonal ranges)
Price channels are a common pattern in forex charts. They work like ranges, but instead of moving sideways, the price moves up or down inside a slanted channel. Some channels are straight and rectangular, while others gradually narrow or widen over time.
Channels can last for a long time, even years, and represent overall trends. However, most trading chances come from smaller ranges that form inside these trends. Because of this, traders can use either trend-following or breakout strategies to trade channels.
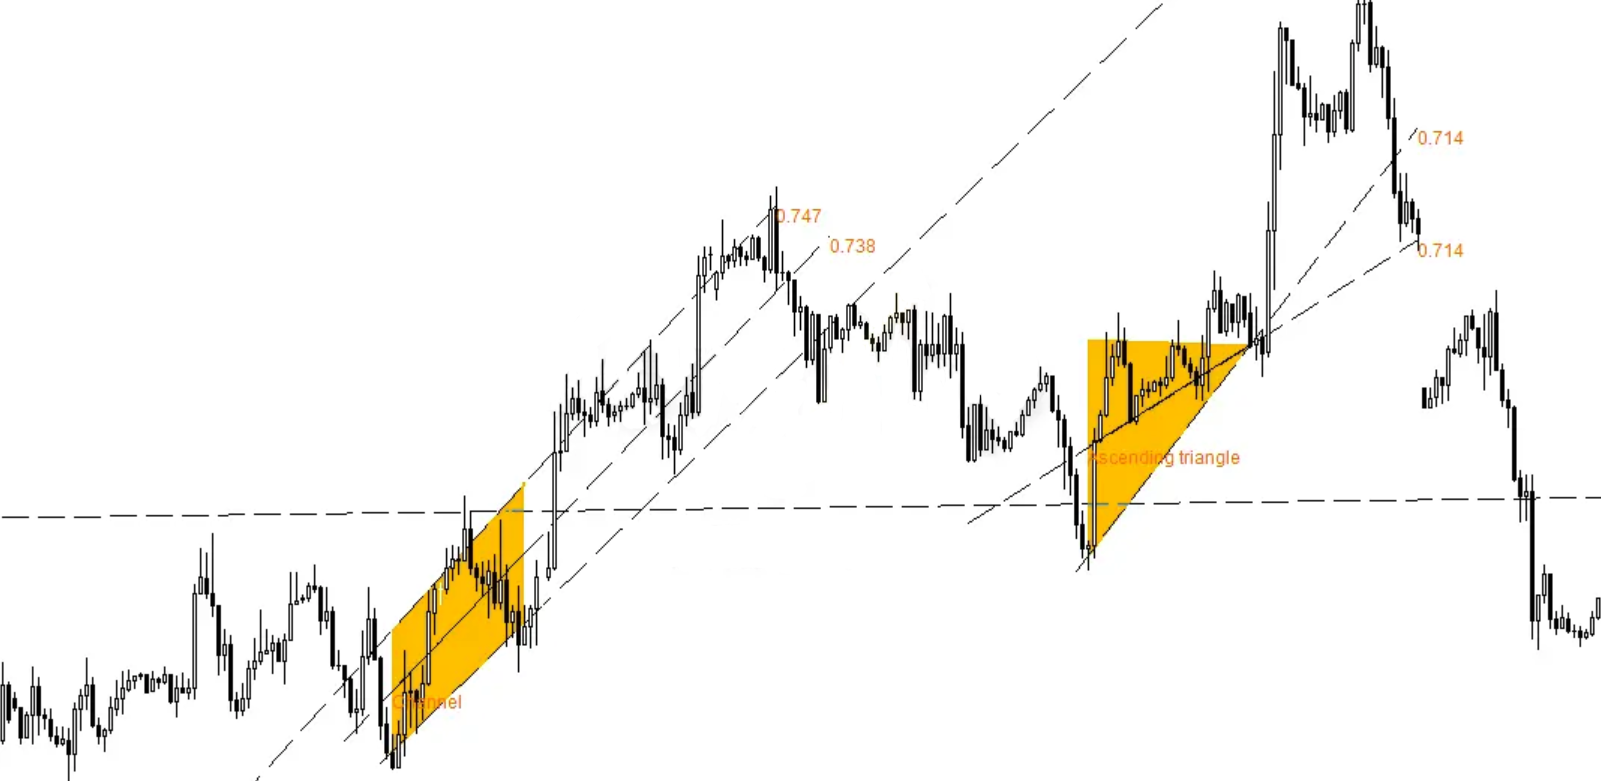
When small channels appear opposite to the main trend, they usually signal the trend will continue. Common examples of these patterns are wedges, flags, and pennants (shown below).
In shorter channel ranges, breakouts often go against the slope. For example, an upward-sloping channel is more likely to break down, while a downward-sloping channel often breaks up. It’s not certain, but this is a helpful guideline in technical analysis.
Figure 6 shows an example. In a rising wedge with a bearish bias, the price breaks downward, erasing most of the gains from the upward move.
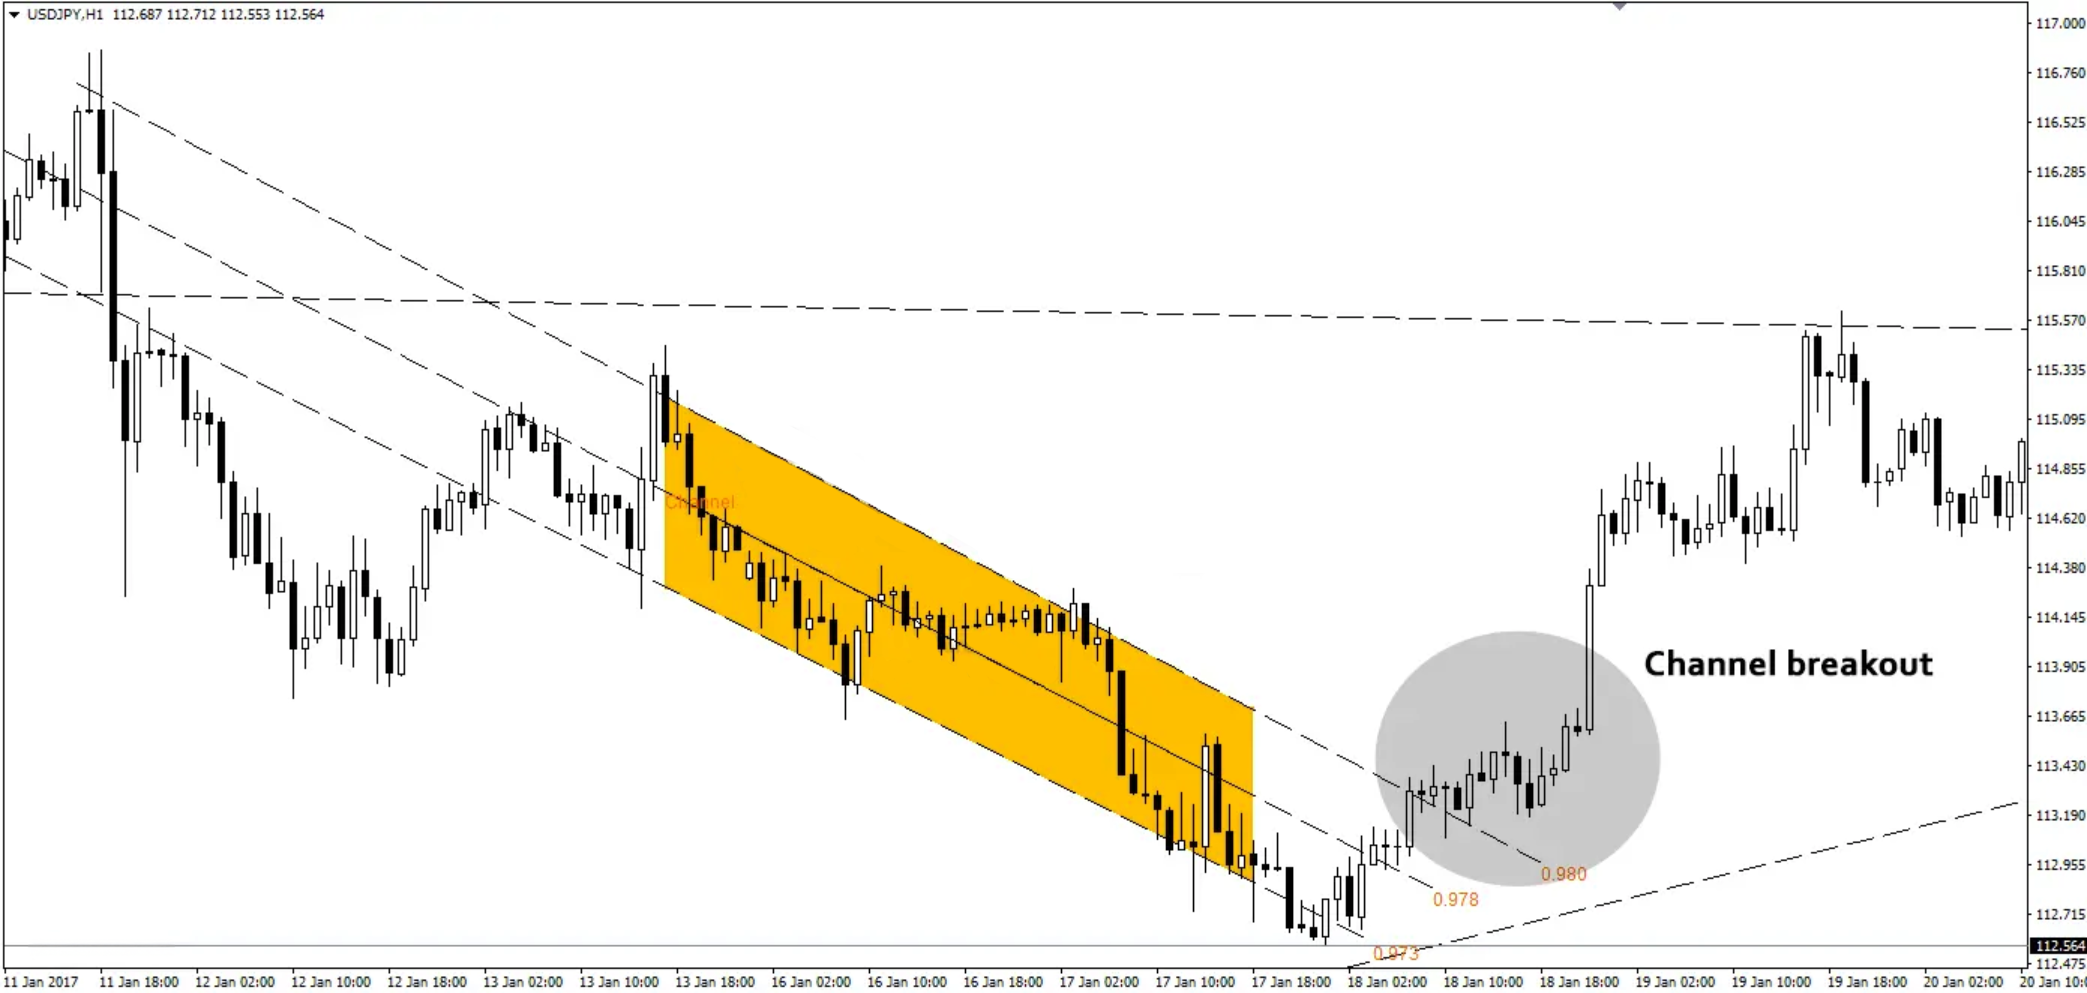
Figure 4 displays a long downward channel. In this case, the price breaks sharply upward, showing how it often retraces against the main move.
False Channel Breakouts
Breakouts can sometimes be false, triggered by things like news events. Automated trading programs may react instantly, causing a quick move. Often, the market has already been priced in the news, so the move quickly reverses, and the price goes back to its previous range.
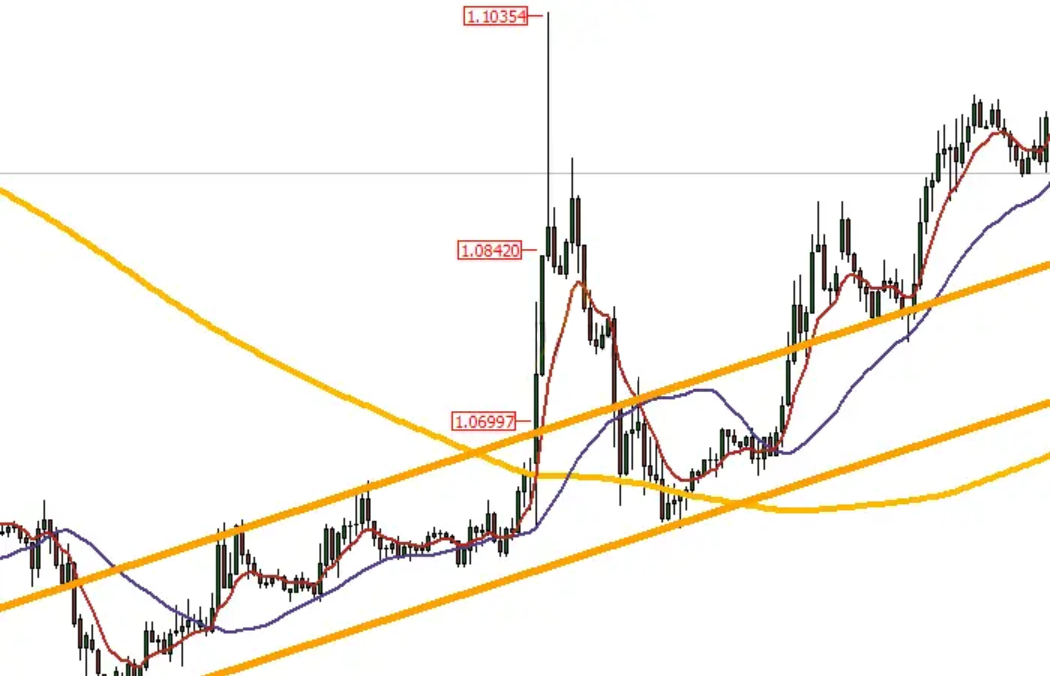
Figure 5 illustrates a breakout that moves in the same direction as the range. This occurred during a US Federal Reserve announcement. After rising about 300 pips, the price quickly returned to the range. Because of this, some traders choose to trade only in one direction based on the slope of the range and the currency pair, instead of trading in both ways.
Trend Continuation Patterns: Flags, Pennants, and Wedges
Continuation patterns are chart formations that appear during an ongoing trend. Common examples include flags, pennants, wedges, and triangles. These patterns usually show a temporary pullback against the main trend and can indicate either upward(bullish) or downward (bearish) movement.

These patterns can appear on any time frame. You can trade them like regular ranges or wait for a breakout, depending on how long you plan to hold trades. When the main trend continues, these patterns often lead to strong upward or downward moves, so many traders prefer to trade them as breakouts.
Irregular Ranges
Some ranges are hard to spot at first glance. In these cases, prices move around a central line, with support and resistance forming nearby. Tools like trendlines and moving averages can help identify the range and locate key support and resistance areas.
Some traders focus on trading near the central line of these ranges instead of the highs or lows. They expect the price to move back toward the middle, using the edges of the range as entry points.
This strategy focuses on taking smaller profits by following the price as it moves toward the middle of the range.
As explained earlier, when the price reaches the edge of the range, it can break out or hit a stop loss. Trading at the edges depends on the price reversing in your favor. Focusing on the middle of the range helps lower the risk of sudden reversals at the edges.
Range Trading Approach
In a typical range, price moves around a central line. Entering trades and setting profit targets closer to the middle instead of the edges gives a higher chance of hitting your target and more trading opportunities. The trade-off is smaller profit potential per trade.
Basic Steps for Trading a Range
- Wait for the price to reverse near the edge of the range or about two-thirds in from the boundary. Usually, the price pauses or consolidates at these points before turning.
- Confirm the reversal with at least two candles moving away from the edge toward the middle of the range.
- Set your take profit (TP) at no more than two-thirds of the total range, since the price often turns before reaching the full support or resistance.
- Place your stop loss a safe distance beyond the range edge to allow for false breakouts. Using the ATR, support/resistance levels, and higher timeframe zones can help determine the stop loss.
Be careful with setups that seem “too perfect.” If a range looks like an easy win, it might not be what it seems. There’s always a chance the price could break out suddenly.
Dealing with Range Breakouts
Breakouts from a range usually aren’t clear or straightforward. This makes trading breakouts or ranges more challenging.
A failed breakout happens when the price moves outside the range but quickly falls back inside. Traders can use various indicators to spot and manage these kinds of false breakouts.
When trading a range, avoid rushing after a breakout. Breakouts can be powerful and quickly take profits away, so if the price moves against you, it’s better to close the trade and wait for a safer chance to enter.
Similarly, avoid trying to trade back into the range after a breakout. In strong ranges, the price often tests the boundary multiple times before fully breaking out, so use these retests as chances to exit your trade.
Because of this, it’s better to skip trades when a breakout seems likely, even if the price returns inside the range. This may mean missing some profit, but it helps reduce losing trades.
TradingLab is not an investment advisory or a similar financial advisory firm. We provide content based on economic, financial analysis, technical analysis, trading strategies, and other subjects found in economic, financial, and business literature.
Sharpen your Trading Strategies
product+
ABOUT US


Risk Disclosure
Trading involves significant risk and may not be suitable for all investors. Trading with high leverage can result in substantial losses, potentially exceeding your initial investment. Prices can be highly volatile and can be influenced by unpredictable external factors, including financial or political events. Only invest money that you can afford to lose. Past performance is not indicative of future results. It is essential to carefully assess the risks before making any trading decisions. Trading with leverage significantly increases the associated risks. All content provided on the website is for informational purposes only and should not be considered as investment advice or a recommendation.
Intellectual Property
You will fully own all intellectual property rights for any material you submit, whether it be text, source code, algorithms, designs, methods, or any other form. It is your sole responsibility to ensure that the information you submit is free from any third-party claims or restrictions. By submitting this information, you explicitly confirm that you have all the necessary rights to use, manage, and share it.


