Grid Trading – Vertical Grid Strategy
Introducing the vertical grid strategy, this article explains how it differs from the horizontal grid that follows price changes, defining the vertical grid approach that places trades at fixed time intervals. It also covers its advantages, practical examples, and methods for handling trend reversals.
Vertical Grid Strategy

Vertical grids, unlike horizontal grids that track price changes, place trades at fixed time intervals regardless of price. This approach is similar to dollar-cost averaging.
Principal of Vertical Grid - Entry Cost Averaging
In Entry Cost Averaging, a vertical grid splits one large trade into smaller equal parts and places them into the market at regular time intervals, instead of waiting for the perfect entry point.
For example, when buying a 1 standard lot, it could be split into 5 smaller trades of 0.2 lots each. The market could be entered five times, at different times, with 0.2 lots each.

These trades occur at different prices, and the overall entry price averages out over time. The more you split the trade, the closer it gets to the true average.
After all the trades are placed, the grid is closed for a profit once the price moves far enough in a favorable direction from the average entry price. It’s okay if some trades lose, as long as the combined result of all trades is positive. This process is called grid averaging.
Pros of Vertical Grid
In a trend, bad timing can lead to quick losses, especially in Forex with high leverage. A vertical grid reduces this risk by spreading trades over time, creating an average entry price. If the average price is going up in an uptrend(or down in a downtrend), you’re more likely to make a profit.
Example of Vertical Grid
Suppose the price is rising and you want to take a long position. You can use a vertical (or aggregating) grid with six trades of 0.2 lots each, totaling 1.2 lots. The trades are placed at equal time intervals, so each one happens after the same amount of time.

Like other grids, it’s better to use one stop loss for the entire system rather than managing each trade separately. Handling trades individually defeats the purpose of averaging.

Figure 2 shows the price chart with the moving average line. Green areas are profits, and red/brown areas are losses. Each grid trade moves the average entry price closer to the moving average.
In an uptrend, this makes sure trades are entered near the average price. When the price rises above the profit target at T7, the whole grid closes with a profit of 205.5 pips.
Risk vs. Reward
Q: Why not just buy once when the price touches the moving average line?
A: Buying once at the moving average might give similar profits or losses as a grid, but it’s less flexible. A grid spreads trades over time, so the trader isn’t fully invested until the last trade. A single large trade is fully committed immediately.
This creates a risk vs. profit trade-off:
- If the price rises quickly before the grid is complete, the grid may miss some profit.
- If the price drops sharply, the grid can stop adding trades and close early, limiting losses compared to a single large trade.
How to set the Grid Time Interval
Important: The time span of your trade entries must match the same order as length of the trend you are trading.
For example, if you want to profit from an hourly trend, using five trades spaced five minutes apart only covers 25 minutes, which isn’t helpful.
The grid entries should cover a period similar to the trend’s length. For example, to capture a trend on a 1-hour chart, your trades should be spread over several hours.
First, decide how many trades to include in the grid. For example, instead of trading 1 standard lot at once, you could split it into 10 trades of 0.1 lots each. If you aim to capture profit over a two-day trend, your trades should be spread over at least one day which is at least half of that period. So:
1 day =24 hours (10 trades of 0.1 lots @ 2.4 hour intervals)
The 10 grid trades can be spaced every 2.4 hours to cover one day, making the average entry price reflect the 24-hour period. In general, the more volatile the market, the longer the averaging period and the more trades you need to get a good estimate of the average price.
Variations of Vertical Grid
Mean Divergence Optimization
Mean Divergence Optimization adjusts grid trades based on how far the price moves from the moving average. For example, in arising trend, the strategy adds to the grid when the price is below the moving average and reduces it when the price is above.
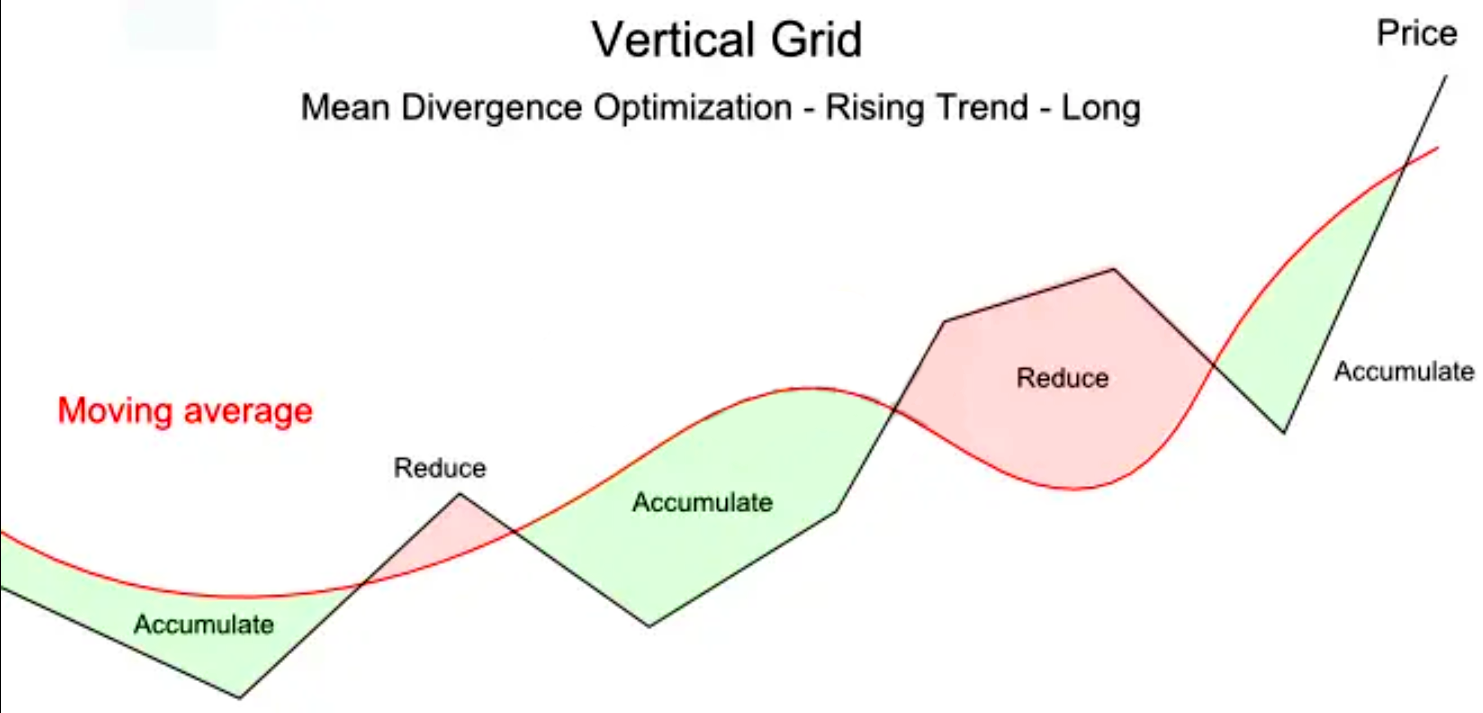
This type of grid is often used by trading advisors and runs continuously, adjusting positions based on the price’s relation to the moving average. The grid follows the long-term trend, like a 4-week moving average. Positions are closed starting with the most profitable, which has the benefit of creating a steady stream of gains. A total stop loss is also in place, closing all trades if the trend suddenly changes.
Fibonacci Time zones
One popular indicator is called the Fibonacci Time zone, which is included in MetaTrader and most charting programs.
Supporters of this method believe major market moves don’t happen at regular intervals but follow the Fibonacci sequence.

Mark points on the time axis using Fibonacci numbers. These points show where the price might change, helping you plan grid trades around likely market pivots.
When using Fibonacci time zones, you pick two points on the chart, called A and B, which can be major highs or lows. Then, extend the Fibonacci zones forward to find good times to enter trades.

Fibonacci time zones can be easily calculated by hand or in Excel, without any special software.
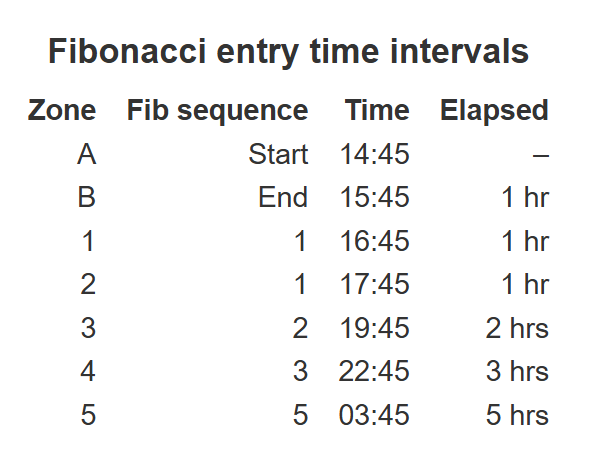
For example, if points A and B are 1 hour apart, the next grid interval follows the Fibonacci sequence:
- Start with 1 hour (1 + 0)
- Second interval: 1 hour
- Third interval: 2 hours (1 + 1)
- Fourth interval: 3 hours (1 + 2)
And so on, adding the two previous intervals each time.
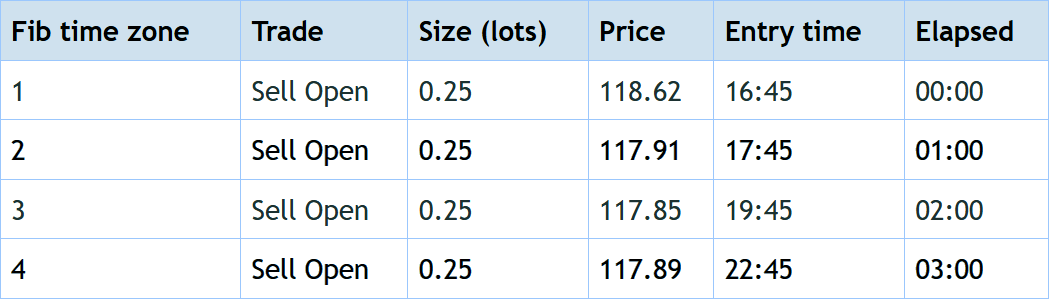
With this method, grid entries aren’t evenly spaced, so the entry prices typically don’t average out.
The Fibo Fan Technique
The Fibonacci fan, or fibo fan, is a tool traders use to help decide when to enter or exit grid trades. It draws support and resistance lines by connecting highs and lows on the chart. An upward-sloping fan shows a rising trend. These lines help predict where the price may find support or resistance. Traders often use the fibo fan with other tools, like Elliott waves or the pitchfork, to see if a trend is continuing or changing.

Figure 6 shows the fibo fan and fibo time zones. The fan predicts trend direction from recent highs and lows, while the time zones suggest when to enter or exit trades. The grid adjusts positions based on the price within each zone, adding in the green area and reducing in the red; with the 50% line as the midpoint.

Trend reversal
No matter the method, always have a plan to close the grid if the trend suddenly reverses. For manual trading, watch the chart closely. For automated systems, use indicators to spot trend changes and close the grid before losses grow too big.

Figure 8 shows an example where the bottom support line of the fibo fan is broken, and the price starts a downward trend. A grid trader should close the grid once this support line is clearly breached.
TradingLab is not an investment advisory or a similar financial advisory firm. We provide content based on economic, financial analysis, technical analysis, trading strategies, and other subjects found in economic, financial, and business literature.
Sharpen your Trading Strategies
product+
ABOUT US


Risk Disclosure
Trading involves significant risk and may not be suitable for all investors. Trading with high leverage can result in substantial losses, potentially exceeding your initial investment. Prices can be highly volatile and can be influenced by unpredictable external factors, including financial or political events. Only invest money that you can afford to lose. Past performance is not indicative of future results. It is essential to carefully assess the risks before making any trading decisions. Trading with leverage significantly increases the associated risks. All content provided on the website is for informational purposes only and should not be considered as investment advice or a recommendation.
Intellectual Property
You will fully own all intellectual property rights for any material you submit, whether it be text, source code, algorithms, designs, methods, or any other form. It is your sole responsibility to ensure that the information you submit is free from any third-party claims or restrictions. By submitting this information, you explicitly confirm that you have all the necessary rights to use, manage, and share it.


